
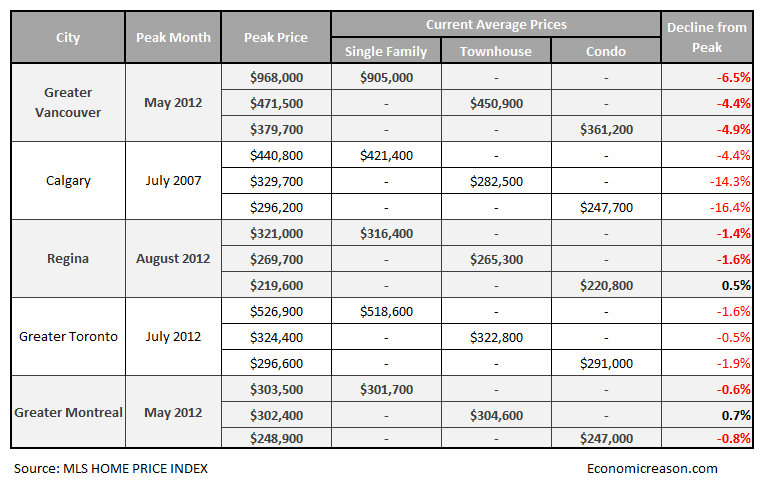
Here are the latest price statistics for Canada’s housing market. Price statistics refer to the updated numbers for the month of December 2012. Declines were again seen in all sectors and regions except for (Montreal townhouses and Regina Condos)
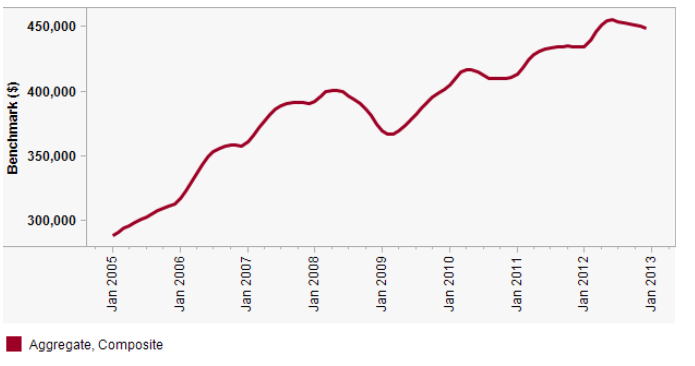
The aggregate price for all sectors and major regions in Canada declined again in December 2012, posing the longest real-estate decline in Canada since 2008. The housing decline, which started in May 2008, ended in March 2009. The graph below shows the aggregate MLS price for across Canada.
Every month I publish an update on these real-estate statistics to get an in-depth view of the current trends in the Canadian housing market. If you would like to receive an automatic update sent to your email with these statistics, subscribe to the site’s newsletter feed on the right hand side of the page.