
Here are the latest price statistics for Canada’s housing market. Price statistics refer to the updated numbers for the month of April 2013. Generally, positive gains in prices were seen in all sectors and regions for the month of April, with exception to Regina.
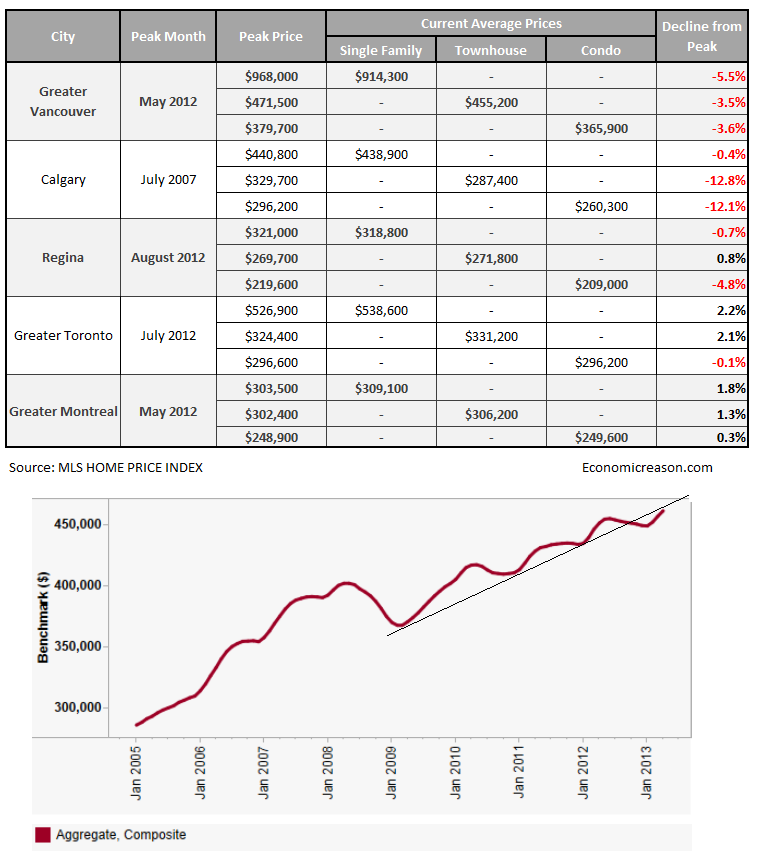
Source: MLS
The aggregate price for all sectors and major regions in Canada gained in April 2013 to $461,000, reaching a new all time high. It seems that the correction we had in the past few months is starting to go back up and test the prior trend line that started in January 2008. All data was taken from the MLS Home Price Index.
Source: MLS
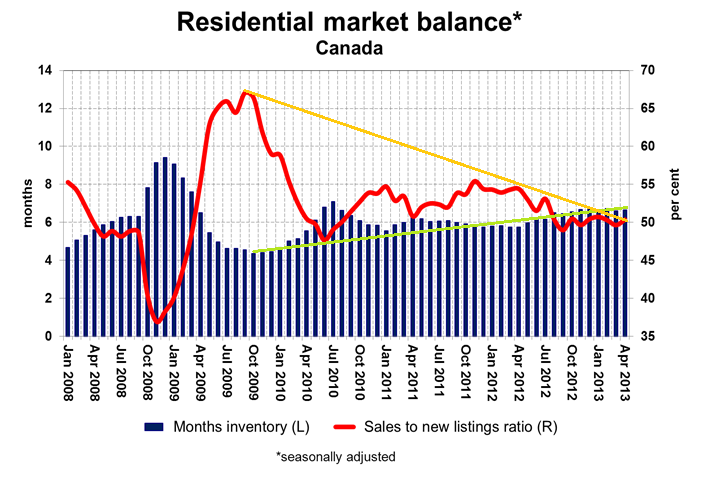
Inventory increased slightly to 6.6 months from 6.5 in March 2013, and sales to new listing ratio remained marginally unchanged. Nevertheless, the trend of inventories (green line in picture above) continues to be sloped upward while the trend of sales to new listing ratio (orange line in picture above) continues to be sloped downward. Indicating continued downward pressure in prices could be expected.
Every month I publish an update on these real-estate statistics to get an in-depth view of the current trends in the Canadian housing market. If you would like to receive an automatic update sent to your email with these statistics, subscribe to the site’s newsletter feed on the right hand side of the page. This post is by no -means financial advice